How many solar panels would be needed to 100% solar-power Singapore?
Tue Jun 02 2020tags: exploration data science public featured
Principal investigators: Michael and Celine
Summary
We use horizontal irradiance data, Singapore's half-hourly power demand statistics and solar panel schematics to calculate the area of solar panels (and battery storage) needed to meet Singapore's energy demands. We calculate that an area of 30,000 hectares would be more than sufficient, provided we have enough battery storage.
I'm certain that I've missed something: all feedback and corrections are most welcome.
Thanks very much to Michael and Celine for researching this problem with me: whatever errors remain are mine alone.
Background and motivation
I saw this infographic from the Straits Times talking about an ambitious plan to build a huge solar farm and cable the energy over to Singapore. This piqued my interest, so I went to the company's website to learn more.
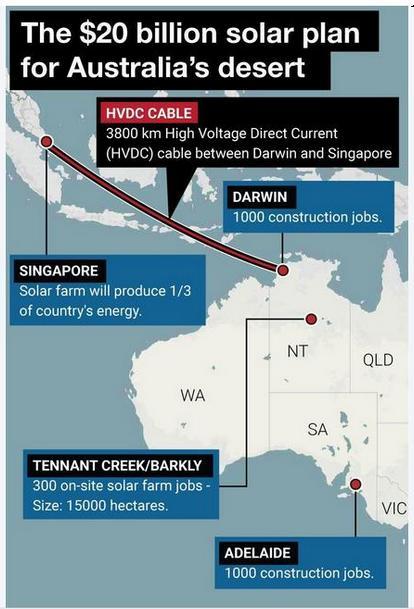
What I found puzzled me. The Straits Times infographic claims that the farm will occupy 15,000 hectares and provide a third of Singapore's energy. But the website claims that the farm will occupy 12,000 hectares and provide a fifth of Singapore's energy.
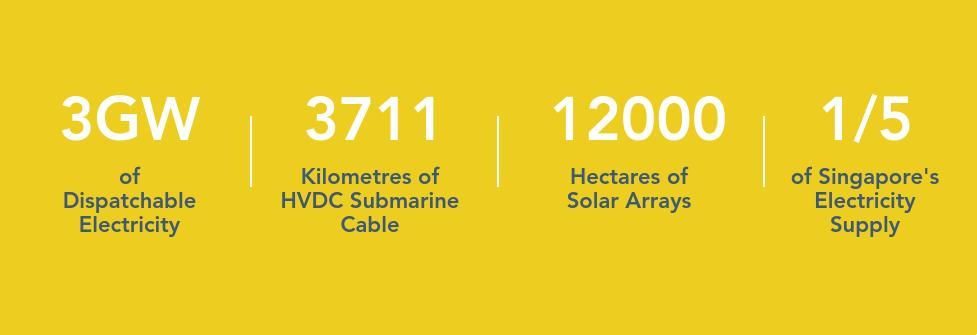
So which is it? 1/5th or 1/3rd? No matter how you slice it the numbers don't make sense. So I decided to take matters into my own hands and calculate it myself. I want to find out: what area of solar panels would we need to provide 100% of Singapore's energy?
Strategy
We'll tackle this question in two main parts: on the supply and on the demand side.
- How much energy does Singapore demand?
- How much energy can be produced per unit area?
- How much energy falls onto the ground per unit area?
- How much of that energy can we soak up per unit area?
Demand-side: how much energy does Singapore demand?
How much power does Singapore demand? The answer depends of course on "over what period"? Because solar power varies greatly throughout the day, we should take the highest-resolution snapshot of the data.
The best I could get was half-hourly power demand figures obtained from Singapore's Data.gov.sg. The dataset starts in 2012 and ends in 2017 but I extrapolated it to 2020 (by taking the geometric mean).
The chart below plots how power demand varies throughout the day in Watts. Pick any date from 22 Feb 2020 to 20 June 2020 to see how power demand varied during that day.
Surprisingly, power usage tends to dip during working hours and go up during the wee hours of the night. I'm not sure why this is the case: maybe I made a mistake?
Supply-side
How much power can we collect from the sun? If we know the amount of sunlight that shines on a unit area, and we know the efficiency of the solar panels, then the total power collected is
And as long as the total power produced exceeds the power demanded by Singapore, we're in the green!
It's not that easy, of course. The amount of sunlight incident upon a unit area depends on things like weather conditions and the time of day. And efficiency depends on ambient temperature and the angle of solar panels, among other things. We'll have to make several simplifying assumptions to proceed.
How much energy hits the ground? Global Horizontal Irradiance (GHI)
From Wikipedia:
Solar irradiance is the power per unit area (watt per square metre, W/m2), received from the Sun in the form of electromagnetic radiation.
Irradiance on the Earth's surface depends on the tilt of the measuring surface, which we'll account for later. At the moment, we'll use a simplifying measure: that of horizontal irradiance (GHI), which measures the power received by a horizontal surface per unit area.
We need to get time-series GHI data because solar irradiance changes dramatically throughout the day (the sun rises and sets, after all). I got the GHI data from the DKA Solar Centre. The DKA Solar Center describes the data in the following way:
A series of four Class A meteorological stations across the Northern Territory collect high resolution solar and climate resource data from locations in Darwin, Katherine, Tennant Creek and Alice Springs.
I used the data from the Darwin meteorological station, but on reflection I should've used Tennant Creek because that's where the site would have been built.
How much energy can we collect?
Knowing how much energy hits the surface is one thing, but what we really care about is how much energy we can collect. This is the most finicky bit of the calculation, because there are many many different factors that affect efficiency. To make the problem tractable we group the losses into three, in decreasing order of importance:
- The "base" efficiency of the solar panel
- The angle of the solar panels (in appendix)
- All other losses (e.g. dirt/soiling/conversion/temperature/whatever)
Feel free to skip any of these sections as they are quite finicky and not that important for the big picture.
Efficiency of the solar panel
I calculated the "base" efficiency of the solar panels to be 16.4%. That is, for every 1kWh of energy that hits the ground, the solar panel would produce 0.16 kWh. I got this number as follows:
Referencing the spec sheets given by Sun Cable's solar panel supplier, each solar panel module has a width of 5550mm and a length of 37330mm. The area is therefore 207.8 sq m.
How much power does it generate? According to the spec sheet, the module produces 34.2 kWp. But what sort of unit is this? It turns out that kWp stands for "kilowatt-peaks", or nominal power, and we'll need this value to calculate the efficiency.
From Wikipedia:
The nominal power of PV devices is measured under Standard Test Conditions... Specifically, the light intensity is 1000 W/m2, with a spectrum similar to sunlight hitting the earth's surface at latitude 35°N in the summer (airmass 1.5), the temperature of the cells being 25 °C.
And so we can get the efficiency of the solar module by dividing the kWp by the area of the solar module. This module produces 34.2 kWp at peak with 207.8 sqm which means that the efficiency is 16.4%. That is, if irradiance were , you'd get from the solar panel.
What does this mean? It means that for every m^2 of solar panels we install, we would get 0.16kW of power per 1kW of horizontal irradiance. This is exactly what we need: just multiply the horizontal irradiance data by 0.16. Of course, there are still other power losses, which we'll now consider.
Miscellaneous losses
There are a ton of other miscellaneous power losses. The SolarGIS website lists "solar radiation, air temperature, and terrain" as factors in calculating energy output, as well as "losses due to dirt and soiling" and the "cumulative effect of other conversion losses".
In the simulation, losses due to dirt and soiling was estimated to be 3.5%. The cumulative effect of other conversion losses (inter-row shading, mismatch, inverters, cables, transformer, etc.) is assumed to be 7.5%. The power plant availability is considered to be 100%.
The SolarGIS website gives , but here we'll be conservative. We'll take an additional fudge factor and say that 15% of energy is lost. And thus the ratio of power produced (PVOUT) to incident power (GHI) is
We'll use this value henceforth.
Supply-side graph
In the previous section we calculated that (0.164 * 0.85) of energy from the sun would be converted into usable energy. The following graph displays how GHI and PVOUT vary throughout the day per unit area.
Again, you can use the date scrubber to view all the days in the dataset. Check out 9 March 2020: it seems to have been a particularly overcast day,
Putting it all together
We've built the demand and supply sides, and all we need to do now is to put them together! The graph below superposes the demand and supply graphs.
The supply graph starts off tiny, but grows as we increase the area of solar panels. Move the slider to increase the area of solar panels and watch the supply graph grow. Assuming we have enough battery storage, we have enough solar panels to fulfill Singapore's peak power demands when the area under the red curve (total solar energy that is collected for a given area) exceeds the area under the blue curve (total power demand of Singapore).
I've calculated the difference in these two areas (total net supply) in MW. Using the slider, increase the area of solar panels until the total net supply becomes positive.
MWDepending on the day's weather conditions, the area of solar panels needed to generate more power than demand also varies. Try using the date picker again.
The graph belows shows the minimum area of solar panels needed to meet daily demand. Increase the area of solar panels (red line) to see how much area we would need to meet demand on most days.
We can see that at 40,000 square hectares we would have a huge surplus on most days and would only fail to meet demand for three days in the entire period. With battery storage one could bank up the surplus energy and draw it down during cloudy days.
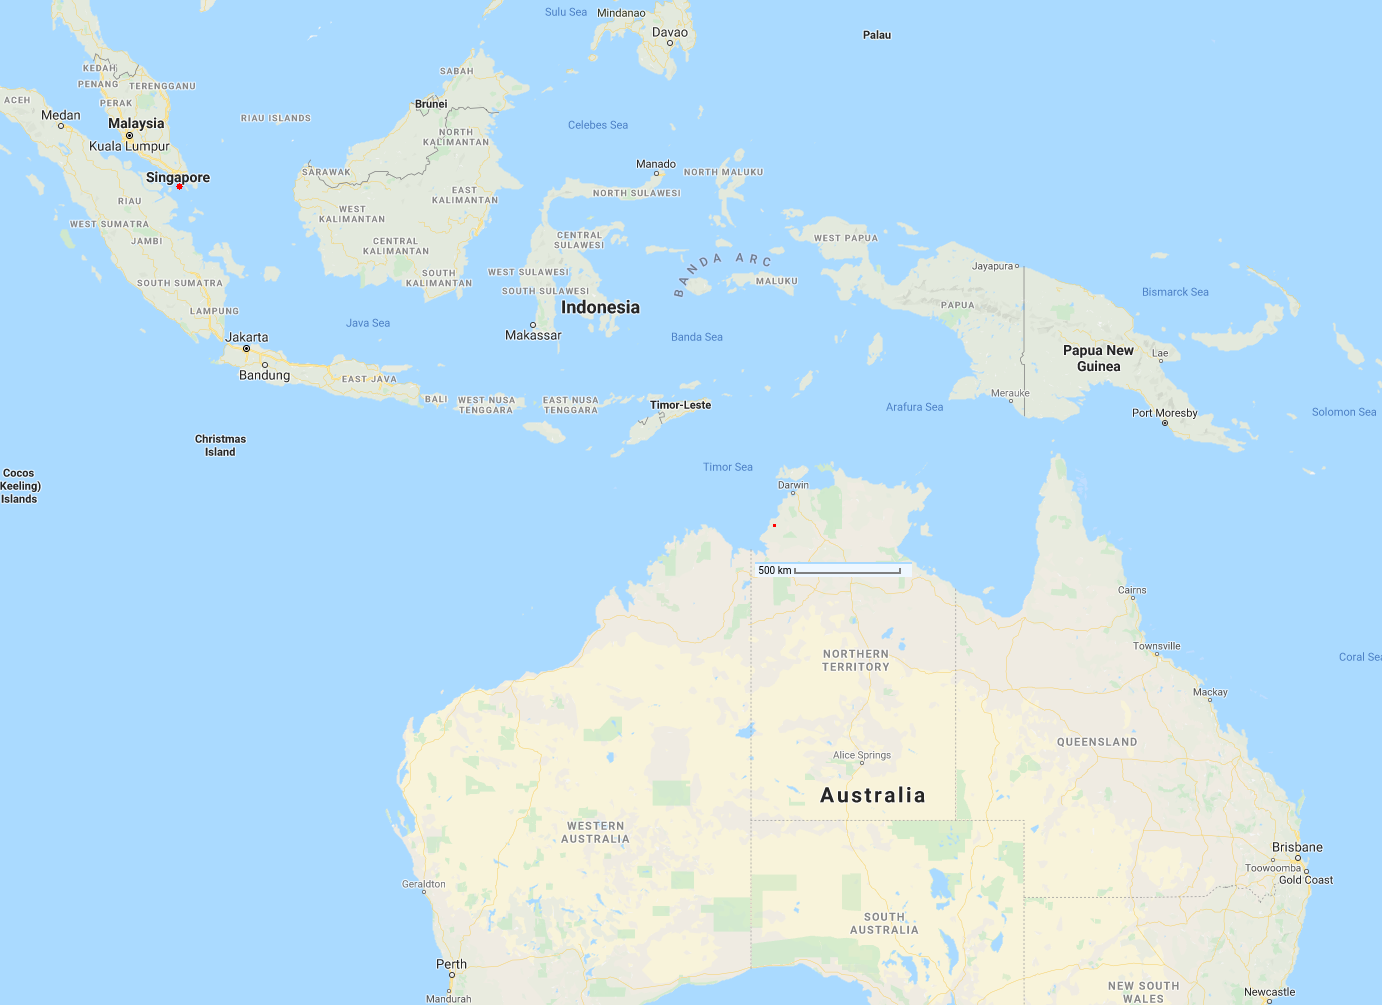
How does that area actually look like?
In the image below, I've marked in red the square area of solar panels needed to fully power Singapore (~30,000 hectares). This is what that looks like (map from Google Maps):
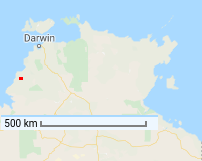
A length of 100 pixels corresponds to a 500km distance. 1 pixel therefore represents 5km, and a 1x1 pixel square represents an area of 25 sq km. And 30,000 hectares is 300 sq km, which is a 3x4 rectangle---which is what I've drawn on the map.
Zooming out to the entirety of Australia:
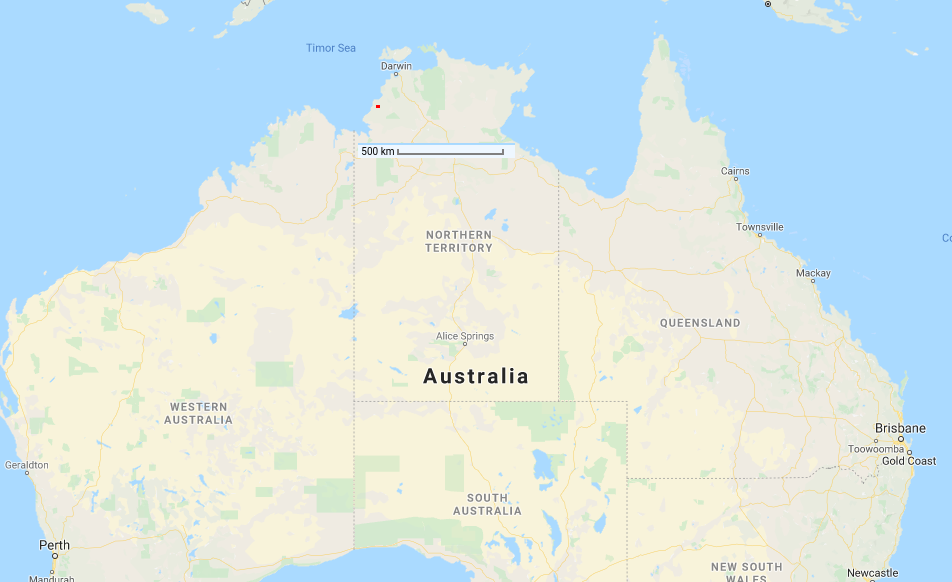
Australia is huge: all the solar panels would occupy an area only one-tenth the size of Darwin (3600 sq km).
The area of Singapore is (very generously) 900 sq km, so this corresponds to about a 6x6 pixel square. Placing the solar panels in Singapore, they'd occupy more than one-third of our land area (so not a great idea). Here I've zoomed out and marked the (approximate) square area of Singapore:
Conclusion
Building a solar farm to power all of Singapore is actually not that ambitious. The largest extant solar farm as of 2020 is the Pagavada Solar Park in India (2050 MW), which covers an area of 53 sq km. Our hypothetical solar farm is six times that---which sounds big---but India's building these solar parks like nobody's business. The Bhadla Solar Park (2245 MW) is 45 sq km, and the upcoming Dholera Solar Park is a whopping 5000MW (which will be ~ 100 sq km). The solar park proposed by Sun Cable is only a bit larger than Dholera Solar Park, and the solar park that would meet Singapore's energy demands is only two or three times the size: well within the realms of possibility.
Future work should calculate the amount of battery storage needed to store enough surplus so as to handle bouts of inclement weather.
Appendix
Things that I didn't deem important enough to put into the main text
Tilt of the solar panels
The tilt of the solar panel affects power generation.[1]
It turns out that "for a fixed tilt angle, the maximum power over the course of a year is obtained when the tilt angle is equal to the latitude of the location" (source: PVeducation.org)
The spec sheet says that the angle of these solar panels is 20 degrees and the latitude of Tennant Creek is 19 degrees, so we're basically as close to optimal as we can get.
Transmission losses
Wikipedia Super Grid Article says that the latest generation of High-voltage direct current power lines can transmit energy with losses of only 1.6% per 1000km:
Sun Cable is using a High Voltage Direct Current Lines, which have quoted transmission losses as less than 3% per 1,000km. (Source: Wikipedia)
The distance between Singapore and Darwin, Australia is around 4,000km.
Thus, we’d get around losses - one-eighth of the energy produced would be lost on transport.
Storage losses, batteries needed, and how much area those batteries would occupy
TODO: not that much, batteries are pretty dense. Wouldn't add more than 10% of the area of the solar panels.
From random Googling, battery storage seems to be 85% efficient.